 App Development & AI Automation
 Contact Us
Page load speed is a non-negotiable
We see this constantly. A brand invests in design, SEO, and paid ads — then loses a significant portion of that investment on a website that loads in five seconds. The traffic arrives. The page doesn't. The visitor leaves.
Speed isn't a technical nicety. It's the first UX decision your website makes — before a visitor reads a single word.
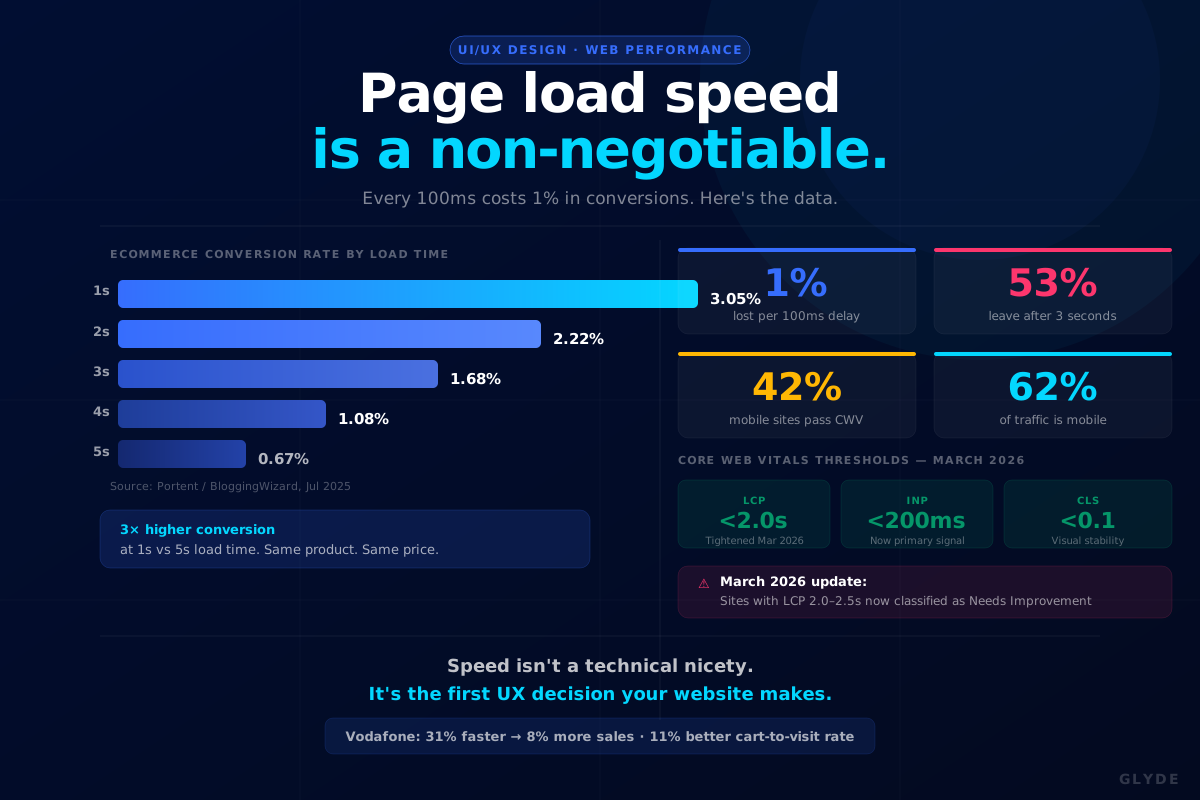
1%Conversion loss per 100ms of load time
53%Of mobile users leave after 3 seconds
42%Of mobile sites pass Core Web Vitals
Speed vs conversions
The conversion cliff is real
Portent's data, analysed across over 100 million page views, shows the conversion cliff clearly. The difference between a 1-second and a 5-second load time isn't marginal — it's the difference between running a business and running a leaking bucket.
E-commerce conversion rate by load time (Portent / BloggingWizard, Jul 2025)
A 1-second site converts at 3× the rate of a 5-second site. For a store doing $1M/year, a 500ms improvement is worth ~$500K in recovered revenue.
Google March 2026 update
Speed is now an explicit ranking signal
The March 2026 Google core update raised the stakes materially. Two things happened simultaneously: the LCP "Good" threshold tightened from 2.5s to 2.0s, and INP (Interaction to Next Paint) was elevated to a primary ranking signal alongside LCP and CLS. If your site had an LCP of 2.3 seconds in February, you went from passing to failing in March — without changing a single line of code.
LCP
<2.0sLargest Contentful Paint
New threshold from Mar 2026
New threshold from Mar 2026
INP
<200msInteraction to Next Paint
Now a primary ranking signal
Now a primary ranking signal
CLS
<0.1Cumulative Layout Shift
Visual stability measure
Visual stability measure
Pages in position 1 on Google now show a 10% higher Core Web Vitals pass rate than pages in position 9. Speed isn't just a conversion lever — it's a ranking tiebreaker. And 43% of sites are still failing INP alone.
The mobile problem
62% of traffic, half the performance
Mobile now accounts for 62% of all e-commerce traffic. Yet only 42% of mobile sites pass Core Web Vitals. Desktop averages 1.7 seconds; mobile averages 1.9 seconds globally — but mobile pages take 70.9% longer to load than desktop when measured across the full web. Most businesses optimise for desktop. Most of their customers are on mobile.
| Device | Avg load time | CWV pass rate | Traffic share |
|---|---|---|---|
| Desktop | 1.7 seconds | 63% | 38% |
| Mobile | 1.9 seconds | 42% | 62% |
You're spending ad budget to send mobile users to a page that fails Google's own performance standards. That's not a technical problem. It's a business problem.
What's actually slowing you down
The usual culprits
01Unoptimised imagesLargest single cause of slow LCP — compress, resize, use WebPHigh
02Render-blocking JavaScriptDefer non-critical JS, reduce bundle sizeHigh
03Third-party scriptsAnalytics, chat, retargeting — each adds 100–400msHigh
04No caching layerServing dynamic pages every request — implement server cachingMedium
05Slow hosting / no CDNEdge CDN vs shared hosting: TTFB of 120ms vs 820msMedium
06Layout instability (CLS)Missing image dimensions, fonts loading without swap, injected adsMedium
Where to start
Fix in this order
FirstRun Google PageSpeed Insights on your homepage and top landing pages. Field data (CrUX) is what Google uses for rankings — not your lab score. Check your Core Web Vitals report in Google Search Console too.
ThenFix your hero image first. The hero is almost always the LCP element. Convert to WebP, set explicit dimensions, preload it. This single change moves LCP more than anything else.
ThenAudit your third-party scripts. Load your page in Chrome DevTools and count the scripts. Most businesses are running 15–30. Many are duplicates, outdated, or firing on pages where they're irrelevant.
ThenImplement server-side caching and a CDN. The gap between edge CDN (120ms TTFB) and shared hosting (820ms TTFB) is enormous. If you're on cheap shared hosting and wonder why your LCP fails — this is why.
FinallyTest on a real device, not your office wifi. Use Chrome DevTools to throttle to "Fast 4G" and run the test again. This is what your users actually experience.
Vodafone improved load speed by 31% and saw an 8% increase in sales and an 11% improvement in cart-to-visit rate. Same product. Same price. Just faster.
How Glyde approaches it
Performance is built in, not bolted on
The most common performance mistake is treating speed as a post-launch fix — something to optimise after the site is live. By then, the architectural decisions that cause slowness are already baked in. At Glyde, performance architecture is a build decision, not a patch.
Every site we build is structured around clean code, optimised image pipelines, edge hosting, and lean JavaScript from the start. The result is a site that passes Core Web Vitals on launch day — not six months later after a round of emergency fixes.
The Glyde Growth Framework
01
PositionBrand strategy02
DesignVisual identity03
BuildWebsite & assets04
MarketSEO · Ads · Social05
ScaleSustainable growthIs your site fast enough?
Glyde audits and rebuilds websites designed to pass Core Web Vitals on launch — not as an afterthought.
Get a free speed audit →Sources & references
- Page Speed Statistics 2026: Performance and Revenue Impact — DigitalApplied (Apr 2026)
- 13 Website Page Load Time Statistics — BloggingWizard (Jul 2025)
- Website Load Time Statistics 2025 — KanukaDigital (Nov 2025)
- Website Load Time Statistics — Hostinger (Feb 2026)
- Website Speed Statistics incl. Vodafone case — Tenet (Nov 2025)
- 80+ Page Speed & Core Web Vitals Statistics 2026 — BloggersIdeas (Jun 2026)
- Core Web Vitals 2026: How Page Speed Affects Rankings — Deftsoft (Jun 2026)
- Core Web Vitals — Google Search Central (Dec 2025)